
EHS Global Census 2025
What 286 Participants Across 20+ Countries Revealed
The first integrated analysis of lifestyle exposure, symptom burden, and sleep quality among individuals reporting electromagnetic sensitivity worldwide. These findings don't describe a problem. They redefine how we understand it.
← Back to EHS Global CensusThe data at a glance
Five numbers that tell the story
Principal findings
Five discoveries that reframe EHS
The data challenges the assumption that electromagnetic sensitivity is a single condition with a single cause. What emerged is more complex, more personal, and more actionable than expected.
Biology predicts more than exposure does
Environmental sensitivities explain 21.1% of symptom variance (r = 0.460), while EMF exposure patterns explain 17.3% (r = 0.416). What a person is biologically may matter more than what they are exposed to. This shifts the conversation from purely environmental intervention toward understanding individual vulnerability.
EHS rarely travels alone
76% of EHS-reporting participants also report at least one other environmental sensitivity. Those with any additional sensitivity show 67% higher symptom scores. And the more sensitivities a person reports, the worse their symptoms (r = 0.321, p = 0.002). EHS appears to be part of a broader pattern of environmental vulnerability, not an isolated reaction.
Sleep is the strongest thread in the entire dataset
The symptom-sleep correlation (r = 0.633, p < 0.001) is the single most robust finding across all three surveys. Sleep disruption alone explains over 40% of symptom variance, more than double any other factor. This bidirectional relationship suggests that sleep may be the most effective point of intervention for clinicians working with EHS patients.
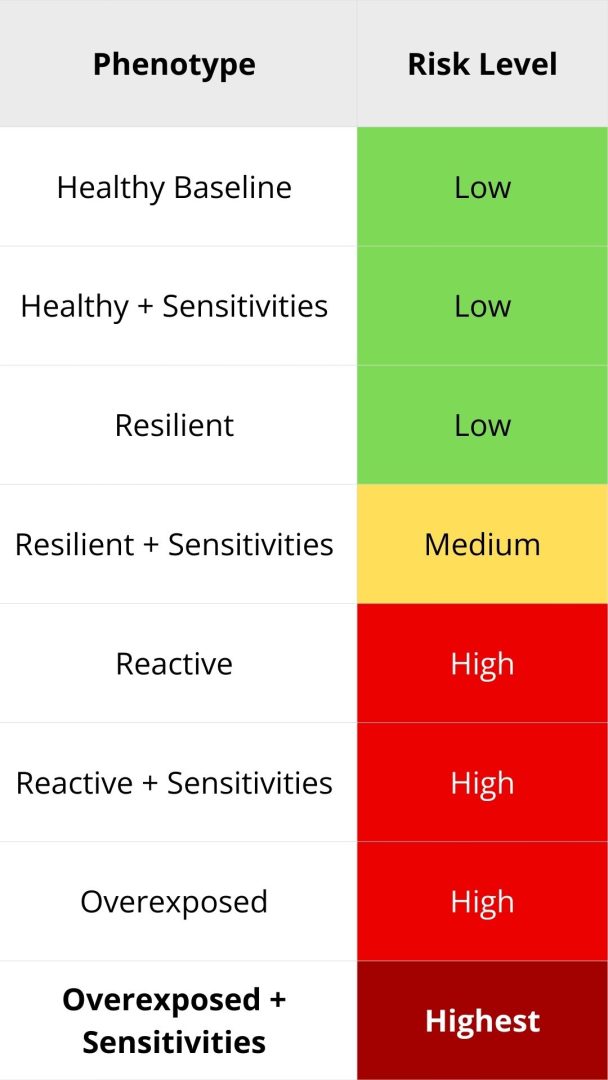
Eight phenotypes, not one condition
Participants cluster into four primary exposure-symptom patterns: Healthy Baseline, Resilient, Reactive, and Overexposed. Each of these subdivides further based on sensitivity burden, producing eight distinct phenotypes. The clinical implication is significant: a one-size-fits-all approach to EHS is unlikely to work. Personalized strategies, matched to phenotype, are the logical next step.
Nearly half need professional-level support
44.7% of participants fall into moderate risk or higher, meeting thresholds that indicate a need for structured intervention beyond self-management. Another 23.2% score in the high-severity range. These are not edge cases. They represent a substantial portion of the assessed population, and they need care pathways that do not yet exist in most healthcare systems.
The sleep paradox
They sleep enough. They don't recover.
One of the most counterintuitive findings in the census came from Survey C. The expectation was insomnia. What emerged instead was something harder to detect and arguably harder to treat: non-restorative sleep.
Most participants report sleeping a normal number of hours. But the sleep itself is failing to do its job. They wake tired. Daytime dysfunction, not nighttime difficulty, is the dominant pattern. Factor analysis confirmed that daytime functional impairment (fatigue, difficulty concentrating, mood changes, headaches) explains more variance than sleep initiation problems.
This distinction matters because standard sleep assessments focus on how long a person sleeps and how quickly they fall asleep. Those metrics look normal here. The problem is invisible to conventional screening, which means it is likely being missed at scale.
(6 to 8 per night)
refreshed
Who participated
A global and diverse cohort
286 unique individuals across 20+ countries contributed to the largest characterization of electromagnetic hypersensitivity to date. The three surveys could be taken independently, resulting in different sample sizes for each domain.
| Category | Female / Male | F : M |
|---|---|---|
| No clear EHS | 1.6 : 1 | |
| Possible ES | 1.5 : 1 | |
| Intermittent ES | 1.6 : 1 | |
| Electro-Sensitivity | 3.6 : 1 | |
| EHS (Severe) | 7.5 : 1 |
(Lifestyle & Exposure)
(25 Symptoms)
(Sleep Quality)
(All three surveys)
A finding about the findings
The Completion Paradox
Before interpreting the data, there is something important to understand about who is represented in it and who is not.
Of the 286 people who enrolled, a third completed all three surveys. Seven percent completed two. Sixty percent completed only one. When we compared scores between complete responders and those who stopped after a single survey, a clear pattern emerged: the single-survey group scored 10% higher on lifestyle exposure, 15% higher on symptoms, and 29% higher on sleep dysfunction.
The most affected participants could not finish.
This makes biological sense. Severe sleep disruption impairs cognitive function, energy, concentration, and follow-through capacity. The very symptoms the census tries to measure are the same symptoms that prevent people from completing the measurement. Traditional EHS research, which relies on complete-case analysis, systematically excludes the most severely affected individuals.
The implication: our complete-cohort findings (n=96) likely underestimate true population burden by 20 to 30 percent. The 96 people who finished all three surveys represent the healthiest third of those who sought assessment. This is not a limitation to footnote. It is a structural feature of the condition that every future study should account for.

The reports
Four reports, one integrated picture
Each survey captured a different dimension of the EHS experience and produced its own standalone report. The fourth report integrates all three domains across matched participants to reveal what none of them could show alone.
Lifestyle & Exposure Patterns
Assessed daily electromagnetic hygiene through 35 items covering technology use, sleep environment, device proximity, screen time, outdoor exposure, grounding habits, and sensory sensitivities. Established each participant's baseline exposure profile.
25 Common Symptoms
Quantified symptom burden across six body systems: neurological, cardiovascular, dermatological, auditory/visual, cognitive/emotional, and somatosensory. Each of 25 symptoms rated 0 to 10 for severity.
Sleep Quality & Disorders
Evaluated sleep architecture, 10 symptom dimensions, four binary disorder indicators (including bruxism and restless legs), and functional impact on daily life. Positioned sleep as the physiological bridge between exposure and symptoms.
Cross-Survey Analysis with Sensitivity Profiles
The flagship report. Correlates lifestyle exposure (A), symptom burden (B), and sleep quality (C) across the same individuals. Includes the complete correlation matrix, environmental sensitivity analysis, composite risk stratification, the eight-phenotype framework, and the completion paradox.
Interpretation
What this means for EHS
The conventional model treats electromagnetic hypersensitivity as a straightforward relationship: exposure leads to symptoms. The data from this census tells a different story. EHS is better understood as a multifactorial condition in which biological vulnerability, sleep disruption, and cumulative environmental load interact in ways that vary considerably from person to person.
The correlation structure we observed, with sleep dominating, sensitivities strongly predictive, and EMF exposure playing a significant but not overwhelming role, calls for a corresponding shift in how clinicians, researchers, and policymakers approach this condition. The reductive "EMF causes symptoms" model is not wrong, but it is incomplete. It misses the terrain.
These findings also reinforce the case for design-based approaches to electromagnetic hygiene. The LEDNA Principle (Low Emission Design Near Field Awareness) offers a framework that aligns with what the data shows: prevention through environmental design is more effective than reactive symptom management, particularly for a condition that involves multiple interacting factors.
What this census has established is a foundation. The eight phenotypes, the sleep-symptom axis, the lifestyle-sensitivity correlation (r = 0.556), and the completion paradox (where the most severely affected individuals are least likely to complete all surveys) all point toward specific research questions that can now be pursued with sharper focus. Longitudinal studies, autonomic function assessments, targeted intervention trials, and biomarker identification are the logical next steps.
The 286 individuals who contributed to this census have provided a roadmap. It is now the responsibility of the scientific and clinical community to follow it.
Implications
What this means for your work
For Practitioners
Prioritize sleep restoration as the highest-yield intervention. Assess for multiple environmental sensitivities, not just EMF exposure. Address total environmental load. The eight phenotypes identified here suggest that personalized approaches, matched to a patient's specific profile, will outperform generalized protocols.
For Researchers
Investigate autonomic function as a potential unifying mechanism. Design studies that account for incomplete responders, whose absence from datasets systematically underestimates disease burden. The lifestyle-sensitivity correlation (r = 0.556) is previously unreported at this scale and warrants targeted investigation.
For Policymakers
Recognize EHS as a multifactorial environmental health condition that requires comprehensive approaches extending beyond EMF exposure limits alone. Nearly half of this cohort meets thresholds for professional intervention. The care pathways they need do not yet exist in most healthcare systems.
Download the Reports
All four reports available as PDF: three individual survey analyses plus the integrated cross-survey report with phenotype framework.
Get the PDFsTake the Surveys
The EHS Global Census is still open. Contribute your experience to the next wave of data collection.
Participate NowFind a Licensed Consultant
Want to understand your results or explore next steps? Connect with a trained EFEIA professional.
Find an Expert