
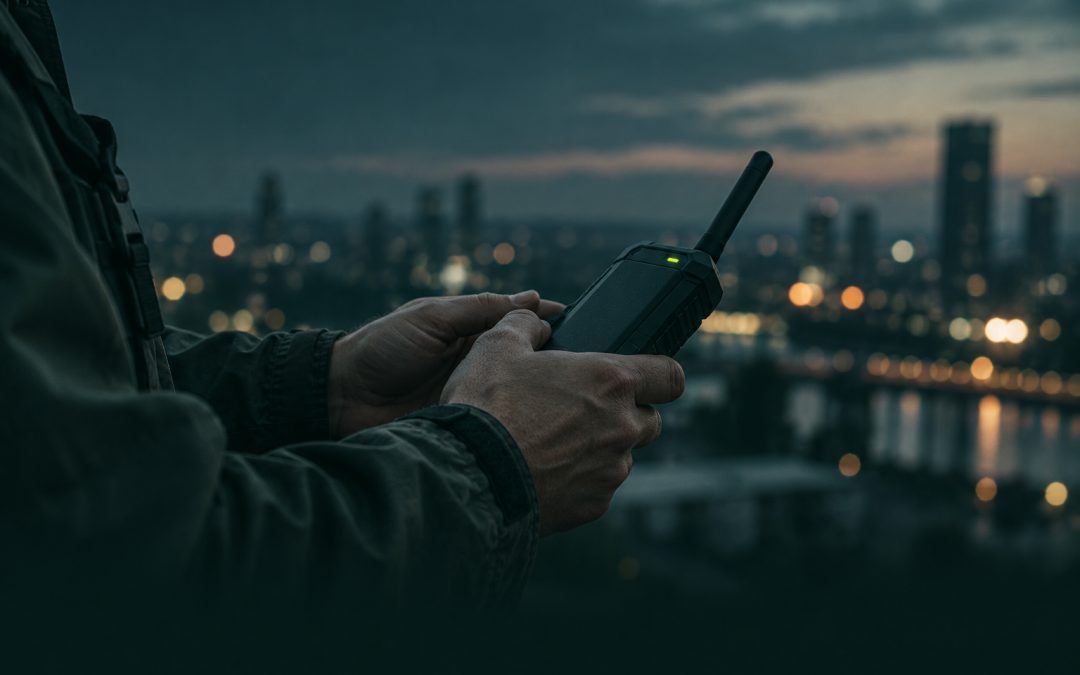
What current instruments miss on a city street, and the measurement requirements proposed in Section 1 of our HHS submission.
Hold a broadband probe up on a New York City street and it may register nothing. Its floor is 0.7 V/m, which is on the order of the median measured across the city. Take the reading again with a frequency-selective analyzer, or while the network is carrying traffic, and the number changes. When your own phone transmits at full power, it can dominate the reading.
A number recorded without the instrument, the network load and the meter’s position says little about what reaches a person. Section 1 of the EFEIA Institute’s response to the U.S. Department of Health and Human Services (HHS) starts from that problem: “Every exposure figure inherits the limits of the instrument that produced it.” The document sets out what current instruments miss in urban environments and what a measurement would need in order to be trusted.
Section 1 is one of eleven documents we submitted in response to HHS’s Request for Information on electromagnetic fields, radiofrequency radiation and wireless exposure. We filed it on 20 October 2026 with Exhibit 1A, a development plan for next-generation measurement instruments, and it is now part of the public record.
Built to check limits, not to describe exposure
Current instruments and protocols were built to check limits averaged over 6 or 30 minutes. Personal exposimeters, the meters worn on the body, measure a fixed list of bands up to about 6 GHz. In a New York City study the list ran from 88 MHz to 5.925 GHz, which leaves out 6 GHz Wi-Fi (5.925 to 7.125 GHz) and millimeter-wave 5G. No commercial personal exposimeter or monitoring node is designed for 5G millimeter-wave bands, and the European uncertainty requirement stops at 6 GHz.
The gaps are not only at millimeter waves. A broadband probe covering 100 MHz to 90 GHz detects nothing below 0.7 V/m, which is the order of the median measured across New York City. Peaks are averaged away, although ICNIRP 2020 adds restrictions for brief exposures, and none of the instruments or protocols the document reviewed records modulation or polarization.
When the network changes, the number changes
In a city, broadcast, mobile downlink, the uplink of nearby phones and Wi-Fi share the same streets, and their levels change with traffic, beam direction and position. In Bern, Switzerland, readings from 5G massive MIMO base stations at 3.6 GHz were 13 to 43 dB higher under full downlink than when idle, in line of sight (mean 28 dB); the document notes that the study was industry-funded and keeps its grade (a). Across 11 locations at 3,500 MHz, another study recorded 0.02 to 0.59 V/m with the network idle and 0.1 to 9.75 V/m during a download.
The instrument and the way it captures the signal matter too: comparing broadband and frequency-selective instruments at the same site produced gaps of up to 12.28 dB. In our own Brickell survey of September 2026, maximum-hold windows averaged about 5.4 times the live-display readings of the same survey, a ratio of mean power densities that the document calculates.
Most studies state an uncertainty of ±3 dB, while measurement choices changed the number by up to 43 dB. Methods do agree on the broad picture: in one French town, four methods gave medians of 0.3 to 0.5 V/m, but they diverged at individual positions and under load. The document asks that the traffic state and the number of active users be recorded with each value.
Zero, a ceiling, and the loudest source
A meter’s floor and ceiling also shape the result. Below the floor, values become zero: in a five-year French synthesis of 5G measurements, significance starts at 0.3 V/m, and every mean and median recorded without a download fell below it, so low ambient levels such as a residential background drop out. Above the ceiling, values are clipped. In a study in Columbia, South Carolina, the meter used saturates at 6 V/m, a level exceeded repeatedly on one street, and its readings at the floor were set to zero.
The document asks for a floor stated per band, at least ten times below the lowest median reported, a range above street-level maxima (13.33 V/m in New York), and out-of-range values flagged, “never zeroed or clipped”. Where the meter sits matters as well. Single body-worn meters read 1.6 to 20.6 times lower than a distributed meter, and body corrections carry an uncertainty of 5.3 to 12.2 dB. Design can close gaps: in one study, a four-node distributed exposimeter reduced the 50% prediction interval of body-worn readings from 12 dB to 3.1 to 3.7 dB, although too few studies exist to standardize body corrections.
The strongest source may be the person’s own phone. Across ten European countries, the mean was 26.32 mW/m² for a user whose phone was at maximum uplink, its transmission toward the network, against 1.10 mW/m² as a non-user. In the document’s words, “The user’s own device dominates”.
From a missing yardstick to a standard
At low frequencies, spot readings miss time-averaged exposure, and the 2 to 150 kHz range (sometimes called “dirty electricity”) has no exposure metric at all. The IEC 61000 standards that cover it protect equipment, not people. One consumer meter used in this range reads about 4,250 of its own units on a clean supply, against a 50-unit threshold with no demonstrated basis. Exposures that add up have no measure either: at most 5 to 7% of health studies address combined exposure, and FCC and ICNIRP rules have no cumulative metric.
Section 1 starts from requirements: EFEIA offers technical definition, testing and validation, not a finished instrument. It proposes a five-stage path: specify (months 1 to 4), test what exists (months 3 to 12), develop or adapt (year 2), validate (years 2 to 3) and standardize (year 3), with methods submitted to the IEEE C95.3 and IEC 62232 committees and sensors aligned with ITU-T K.83. The path would run alongside the pilot of the national monitoring program proposed in Section 2, which supplies the field sites. It proposes assigning the metrology to NIST and the sensor platform to NTIA’s Institute for Telecommunication Sciences, and asks NIST, with the IEEE and IEC committees, to define a human-exposure metric for 2 to 150 kHz and to calibrate consumer meters against it.
Exhibit 1A adds a 24-month plan for a modular family of research instruments that would retain short events, measure electric and magnetic fields separately and report their own detection limits. Funding would be released by milestone, ending with an engineering report on validated performance and limits in months 22 to 24. Until a module passes its gate, the monitoring program would use calibrated existing equipment. Under high event rates, the recorder would log what it discards; in the plan’s words, “A saturated recorder must not report an apparently quiet environment.”
Section 1 is explicit about what a reading within the limits does and does not show: “A value below the limit shows distance from a heating threshold; it does not show that the exposure has been characterized or is under control.”
Our proposal
EFEIA proposes to define the measurement requirements that radiofrequency and microwave instruments must meet in urban environments, and to evaluate, with NIST and accredited laboratories, which current instruments meet them.
From that evaluation, instruments and methods should be developed or adapted, validated in the field and turned into a measurement and reporting standard that can be applied nationwide.
What this document does not claim
EFEIA has not developed or validated a new instrument and does not claim one. Exhibit 1A is a development plan, not a validated instrument, and its figures are preliminary engineering targets, “not demonstrated performance or health thresholds.” The platform it describes would be a research instrument, not a diagnostic or compliance device. The plan notes that real-time analyzers already capture many transients, and any claim of novelty would need separate review. What it calls a micro-peak is an event descriptor, not a health endpoint, and greater measurement detail “does not establish that a detected micro-peak causes biological harm.”
Read the document
Section 1. Limitations of Current Electromagnetic Instrumentation: What Today’s Instruments Miss in Urban Environments, and the Measurement Capabilities Needed. https://doi.org/10.5281/zenodo.23523487
Exhibit 1A. Next Generation Electromagnetic Measurement Instruments: Engineering Development and Validation Plan. https://doi.org/10.5281/zenodo.23513482
Filed on 20 October 2026 to docket HHS-OASH-2026-0397 on Regulations.gov. Tracking number: mvh-ld0k-7q4b.
All eleven documents, presented together: https://efeia.org/efeia-submission-to-the-hhs/
Disclosure. The EFEIA Institute operates within the NOXTAK Corporation ecosystem. J. Joaquín Machado, EMR Researcher and EFEIA Founder & Director, authored or co-authored the eleven documents and is also NOXTAK’s founder and CTO. This article is published by EFEIA Communications.